Exercise: Plotting Csound Data in Python
September 21, 2022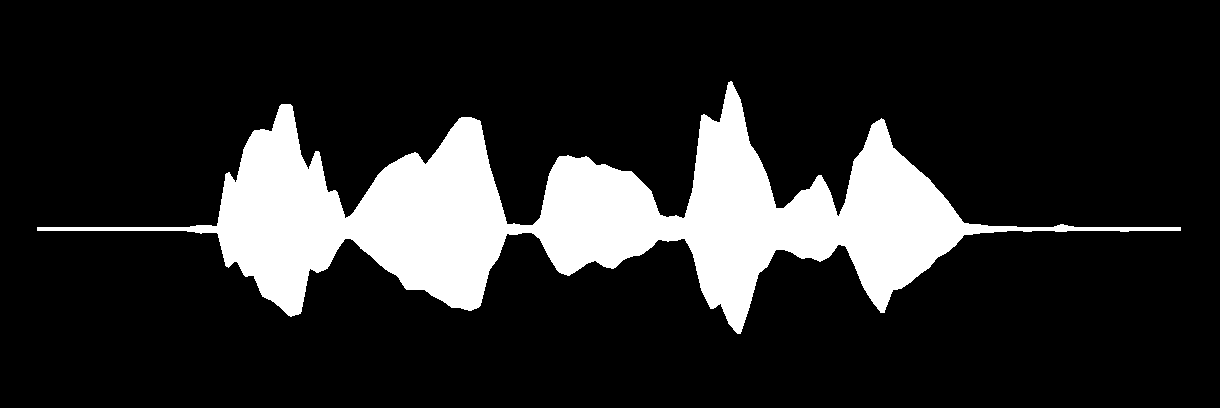
Recently in my quest to find a good GUI framework for building Csound instruments I've been exploring Python and PyQt5. Before this I was exploring Node.js and Electron, but I ran into frustrating problems displaying Csound data in that framework. So when I switched to PyQt5 the first thing I focused on was displaying data. I'm happy to report that the results thus far have been great. Here's the way I've found to display amplitude and frequency data quickly and smoothly.
Updating a PyQt5 Widget
The easiest way to display Csound amplitude in PyQt5 is to use a ready-made widget. This is just a matter of pulling amplitude data from Csound at regular intervals and updating the widget with the data. In order to get the look of a VU meter I used PyQt5's QProgressBar widget. To get the amplitude data out of Csound I experimented with using channels and Open Sound Control (OSC). I'll only show the channel approach here, but the OSC approach seems better when you need to send lots of data at a fast rate between Csound and the GUI.

For this first example, I'll include the complete Csound code and Python code so you can see how everything works together. For later examples I'll only include the snippets of code relevant to the examples.
Csound Code
The Csound code below reads the maximum amplitude of the audio signal every k-cycle and sends it out through a channel named "meter".
<CsoundSynthesizer>
<CsOptions>
-d -odac -iadc -+rtaudio=CoreAudio
</CsOptions>
<CsInstruments>
sr = 44100
nchnls = 1
ksmps = 32
0dbfs = 1

instr 1 ; Microphone input
    asig inch 1
    out asig

    ktrig metro 60
    kmeter max_k asig, ktrig, 1
    chnset kmeter, "meter"
endin

</CsInstruments>
<CsScore>
f 0 z
i 1 0 -1
</CsScore>
</CsoundSynthesizer>
Python Code
In Python I explored two options for receiving the channel data from Csound. The simpler approach is to run a QTimer in the main PyQt5 window that reads the data and updates the QProgressBar widget at regular intervals. The more complicated approach is running a loop in a separate QThread that reads the data and updates the widget using PyQt5's signals and slots to communicate between the threads.
Here's the Python code for the QTimer approach which is run in the QMainWindow.
import sys
import ctcsound
from PyQt5.QtCore import QTimer
from PyQt5.QtWidgets import (
    QApplication,
    QMainWindow,
    QWidget,
    QVBoxLayout,
    QPushButton,
    QProgressBar
)

class MainWindow(QMainWindow):
    '''Main window of program.'''
    def __init__(self):
        super().__init__()
        self.setStyleSheet("background-color: black;")

        # Initiate Csound
        self.csound = ctcsound.Csound()
        self.csound.compileCsd("example.csd")
        self.csound.start()
        self.pt = ctcsound.CsoundPerformanceThread(self.csound.csound())

        # Create layout and widgets
        mainLayout = QVBoxLayout()

        self.button = QPushButton("START")
        self.button.setCheckable(True)
        self.button.clicked.connect(self.the_button_was_clicked)

        self.meter = QProgressBar()
        self.meter.setMaximum(100)
        self.meter.setStyleSheet("QProgressBar::chunk "
                          "{"
                          "background-color: white;"
                          "width: 1px;"
                          "}")
        self.meter.setTextVisible(False)

        mainLayout.addWidget(self.meter)
        mainLayout.addWidget(self.button)
        centralWidget = QWidget()
        centralWidget.setLayout(mainLayout)
        self.setCentralWidget(centralWidget)

    def the_button_was_clicked(self, status):
        if status:
            self.button.setText("STOP")
            self.pt.play()
            self.timer = QTimer()
            self.timer.setInterval(10)
            self.timer.start()
            self.timer.timeout.connect(self.update_data)
        else:
            self.button.setText("START")
            self.pt.pause()
            self.timer.stop()

    def update_data(self):
        volume = self.csound.controlChannel("meter")[0]
        self.meter.setValue(int(volume * 100))

app = QApplication(sys.argv)
window = MainWindow()
window.show()
sys.exit(app.exec_())
I was able to get an average of 40 values per second from the Csound channel with this code. To be honest, I'm not sure why I didn't get more values per second. This rate is adequate for animation purposes, but I'd like to have higher resolution. The later examples I'll show also use Csound channels but the data flows faster.
Plotting a Scrolling Waveform
Next, I wanted to display the amplitude as a scrolling waveform rather than a VU meter. I did a quick browse through online tutorials on displaying waveforms in PyQt5, and I saw that the most common way to do this was by plotting the amplitude data on a graph.

Brilliant! I hadn't thought of that before. When I was using p5.js for my Looper GUI I drew the waveform as a canvas element. That was a lot of extra code. I should have been using a plotting library instead.
Matplotlib is a popular way to plot graphs in Python, but pyqtgraph is better optimized for plotting in PyQt5. The rule of thumb I read is that matplotlib is better for creating print-quality graphs while pyqtgraph is better for animating graphs in real time. I used this tutorial from the very helpful Python GUIs website.
Csound Code
For this plot, I'll use the same Csound channel data from the first example above. Here's the new Csound code for sending values through the channel.
ktrig metro 60
kmeter_minimum max_k asig, ktrig, 3
kmeter_maximum max_k asig, ktrig, 2
chnset kmeter_minimum, "meter_minimum"
chnset kmeter_maximum, "meter_maximum"
Python Code
And here's the new Python code snippets for plotting the waveform.
[Inside MainWindow class]
def __init__(self, *args, **kwargs):
    # Create PlotWidget and add it to window
    self.plotWidget = pyqtgraph.PlotWidget()
    mainLayout.addWidget(self.plotWidget)

    # Initialize the values of x-axis and y-axis
    axis_length = 128
    self.x = []
    self.y_minimum = []
    self.y_maximum = []
    for i in range(axis_length):
        self.x.append(i)
        self.y_minimum.append(0)
        self.y_maximum.append(0)

    # Plot widget styling
    self.plotWidget.setBackground("black")
    self.plotWidget.showGrid(x=False, y=True)
    self.plotWidget.setYRange(-1.5, 1.5, padding=0)
    self.pen = pg.mkPen(color="white", width=4, capstyle="flatcap")
    self.output_plot = self.plotWidget.plot(self.x, self.y_minimum, pen=self.pen, fillLevel=0, brush="white")
    self.output_plot2 = self.plotWidget.plot(self.x, self.y_maximum, pen=self.pen, fillLevel=0, brush="white")
    xaxis = self.plotWidget.getAxis('bottom')
    xaxis.setStyle(showValues=False)

def update_data(self):
    self.x = self.x[1:]
    self.x.append(self.x[-1] + 1)

    self.y_minimum = self.y_minimum[1:]
    self.y_maximum = self.y_maximum[1:]
    meter_maximum = self.csound.controlChannel("meter_maximum")[0]
    meter_minimum = self.csound.controlChannel("meter_minimum")[0]
    self.y_minimum.append(meter_minimum)
    self.y_maximum.append(meter_maximum)

    self.output_plot.setData(self.x, self.y_minimum)
    self.output_plot2.setData(self.x, self.y_maximum)
How the Code Works
The amplitude data is stored in the
self.x,self.y_minimum, andself.y_maximumlists. They are first initialized with placeholder values. We needself.y_minimumandself.y_maximumin order to plot both the top and bottom halves of the waveform.The
self.plotWidget.plot()method adds the x-axis and y-axis data lists to the plot widget. Importantly, we need to assign the return values of.plot()to theself.output_plotandself.output_plot2variables in order to update the plot data later on.The plot animation happens in the
update_data()function. The first elements of the x-axis and y-axis lists are removed, and new values are appended to the end. This is what makes the waveform appear to scroll. The new values added to the end of the y-axis lists are the minimum and maximum signal data received from Csound.The
.setData()methods update the plots with the new data values, which triggers pyqtgraph to redraw the graphs.
Plotting a Momentary Waveform
Instead of plotting a scrolling waveform that lets you see the waveform over time, what if I wanted to plot a snapshot of the momentary waveform? This would require a list of continuous samples of the signal over a brief duration. Using Csound channels won't work in this scenario.

First I tried to use the .inputBuffer() method of ctcsound to get this list of continuous samples from Csound, but the input buffer was only 64 samples long. I intentionally set the buffer to 64 samples in my Csound code to reduce latency for live performance. Unfortunately, 64 samples was too short to get a good visualization of the waveform.
I needed to figure out a way to provide a larger buffer of continuous samples from Csound. I decided to maintain my own "virtual buffer" within Csound in the form of a table, and I could then use ctcsound's .table() method to read the table in Python.
Csound Code
Here's the code in Csound for maintaining a buffer table that is 2,048 samples long.
gibuffer_size = 2048
gibuffer_offet = gibuffer_size - ksmps
ginput_buffer ftgen 1, 0, -gibuffer_size, 2, 0

instr 1 ; Microphone input
    asig inch 1
    out asig

    ftslice 1, 1, ksmps
    kindex = 0
    while kindex < ksmps do
        tablew asig[kindex], kindex, 1, 0, gibuffer_offet
        kindex += 1
    od
endin
Python Code
Here's the Python code that reads data from the table.
[Inside MainWindow class]
def __init__(self, *args, **kwargs):
    # Create PlotWidget and add it to window
    self.plotWidget = pyqtgraph.PlotWidget()
    mainLayout.addWidget(self.plotWidget)

    # Initialize the x-axis
    self.momentary_buffer_length = 512
    self.x_momentary_buffer = []
    for i in range(self.momentary_buffer_length):
        self.x_momentary_buffer.append(i)

    # Plot widget styling
    self.plotWidget.setBackground("black")
    self.plotWidget.showGrid(x=False, y=True)
    self.plotWidget.setYRange(-1.5, 1.5, padding=0)
    self.output_plot = self.plotWidget.plot([], [], pen=self.pen, brush="white")
    xaxis = self.plotWidget.getAxis('bottom')
    xaxis.setStyle(showValues=False)

def update_data(self):
    self.output_plot3.setData(self.x_momentary_buffer, self.csound.table(1)[:self.momentary_buffer_length])
How the Code Works
In Csound I've created a table called
ginput_bufferthat holdsgibuffer_lengthsamples. This is my virtual buffer. For now it's set to 2,048 samples because that works better for plotting momentary waveforms and frequency spectra.In
instr 1the table gets rewritten every k-cycle by theftsliceopcode. Whatftslicedoes is take a copy of theginput_buffertable starting at indexksmpsand writes it back onto theginput_buffertable at index 0. To explain it another way, the table values are shifted to the left byksmpsspaces, which is the number of samples in each k-cycle.The
while kindex < ksmps doloop then writes the audio array of the current k-cycle, which isksmpssamples long, to the end of theginput_buffertable. Thegibuffer_offsetvariable tells thetablewopcode the starting index to write these values to in the table.In Python
self.momentary_buffer_lengthsets the number of samples to be displayed in the momentary waveform. It could be as long asgibuffer_length, but 2,048 is actually pretty large. I've found that "zooming in" to 512 samples works well for teh momentary waveform. You might wonder why I don't just setgibuffer_lengthin Csound to 512 samples. That's because I need the length to be 2,048 to better plot the frequency spectrum as described below.In
update_data()I update the plot by reading in the table data from Csound. Notice that I slice the data list to a length ofself.momentary_buffer_length.
Plotting a Frequency Spectrum
Finally, I wanted to plot the frequency spectrum of the audio signal. To do this I needed to calculate the fast Fourier transform (FFT) on a list of continuous audio samples. SciPy is considered the best Python library for calculating FFTs.
Csound Code
The Csound code is exactly the same as the previous example, so there's no need to repeat it here. The key is that the ginput_buffer table contains the most recent 2,048 samples of audio data which gets updated every k-cycle.
Python Code
import numpy as np
from scipy.fft import rfft, rfftfreq

[Inside MainWindow class]
def __init__(self, *args, **kwargs):
    # Create PlotWidget and add it to window
    self.plotWidget = pyqtgraph.PlotWidget()
    mainLayout.addWidget(self.plotWidget)

    # Plot widget styling
    self.plotWidget.setBackground("black")
    self.plotWidget.showGrid(x=False, y=True)
    self.plotWidget.setYRange(-0.1, 3, padding=0)

    # Set up x-axis with logarithmic units
    self.plotWidget.setLogMode(x=True, y=False)
    xaxis_ticks = [(np.log10(20),"20"),(np.log10(100),"100"),(np.log10(200),"200"),
    (np.log10(400),"400"),(np.log10(600),"600"),(np.log10(1000),"1k"),(np.log10(2000),
    "2k"),(np.log10(3000),"3k"),(np.log10(10000),"10k")]
    xaxis = self.plotWidget.getAxis('bottom')
    xaxis.setTicks([xaxis_ticks])

    self.output_plot = self.plotWidget.plot([], [], pen=self.pen)

def update_data(self):
    fft_spectrum = rfft(self.csound.table(1), norm="ortho")
    freq = rfftfreq(2048, 1./44100)
    self.output_plot.setData(freq, np.abs(fft_spectrum))
How the Code Works
self.plotWidget.setLogMode(x=True, y=False)sets the x-axis to a logarithmic scale. This plots the frequency spectrum along the x-axis in a more useful way.xaxis_ticksis a list of logarithmic values which defines the tick marks along the x-axis. I use NumPy to define the logarithmic values. I learned these techniques from this YouTube video by Mark Jay.rfft()is SciPy's "real FFT" function, which only includes the real numbers in the calculation. This is more efficient, and it meets the needs of the audio analysis well.rfft()reads the data from theginput_buffertable in Csound, performs the RFFT calculation, and outputsfft_spectrumwhich is a list of power values corresponding to frequency bands across the audio spectrum.rfftfreq()generates a list of frequency values that corresponds to the power values contained infft_spectrum. These frequency values are plotted along the x-axis, and the power values are plotted along the y-axis.
Next Steps
So far my exploration of PyQt5 has been successful. I've been able to create quality data animations that easily render at 60 frames per second, and achieving this was much more straightforward in PyQt5 than in Node.js and Electron.
Here are some areas I'll focus on next.
I need to figure out how to properly normalize the FFT data in the frequency spectrum plot. The numbers spike off the charts. There are tutorials for normalizing FFT data online, but for some reason I can't get it to work. I must be doing something wrong or misunderstanding something.
The graphic design of GUIs is important to me for both aesthetic and functional reasons, so I'd like to use the PyQt5 style sheet to better manage the design of the window and widgets.
I built this with PyQt5, but PyQt6 is actually the latest version to be released. At some point I'll switch this over, which might not require any changes to my actual code.
The real test of the PyQt5 framework will come when I create a more complicated application. That will reveal any performance issues that will force me to compromise or get creative with the animation algorithms.
Now the fun can really begin as I dream up new instruments and generative systems with Python and Csound.